Today, March 15, my morning blood sugar reading was 144, which is down 62 points from yesterday's reading. In the past 3 days the
Planetary K-Index has been at a low level, although it is beginning to rise. the x-ray level had been rising for days, which I believe accounts for my rise in blood sugar yesterday. There was; however, a medium sized burst last night. My allergy symptoms have been declining again as well. It suggests that my blood sugar is going to rise due to any rise in the electromagnetic spectrum.
Please note:
I have changed the format of this daily report to reflect the actual sequence of events that start with x-ray bursts, then an x-ray flare, which then produces a CME, which produces turbulence in the solar wind, which then effects the planetary k-index.
If your recall on the 12th and 13th there were 2 significant x-ray bursts
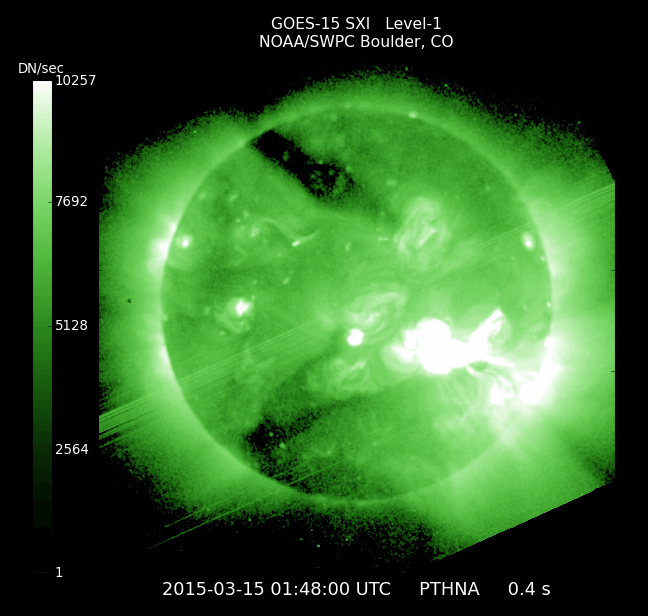
Today there was an x-ray flare at 1:48 UTC, which I believe was related to the above x-ray bursts
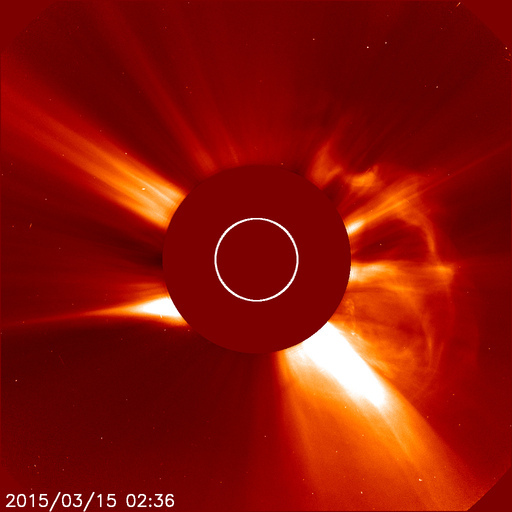
The x-ray flare produced a CME, which was visible on the close range
LASCO Coronagraph at 2:36 UTC
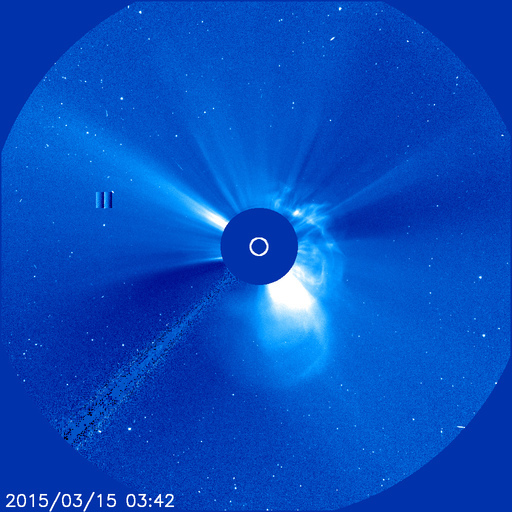
The CME became visible on the long range
LASCO Coronagraph at 3:42 UTC
GOES Proton Flux 03-13 to 15-2015, shows the >10MeV channel is beginning to rise due to a previous CME of a few days ago.
The Electron Proton Alpha Monitor (EPAMp)03-14 to 15-2015 shows a rise in the energy of the electrons and protons in the solar wind impacting the earth, but still within levels 1-3.
This morning the GOES X-Ray Flux chart for 03-13 to 15-2015, shows there was another x-ray bursts of less significance, so we can expect another x-ray flare in the next 24 hours, but it will be smaller than the one we had a few hours ago.
These flares may be due to another
sun-grazing comet reported on the 13th. Comets, especially sun-grazing comets, will have companions, which might be too small for the
LASCO Coronagraph to observe, which might be impacting the sun causing the solar disturbances.
The Estimated Planetary K-Index has begun to rise to 2-3 in response to a rise in the Proton Flux in the last 24 hours.
Real-Time Geomagnetic Conditions total magnetic field (scalar) TUC Tucson Geomagnetic station F channel 47470.3 nT to 47515.4 nT varying 46.1 nT, with a mean of about 47500 nT. The curve shows considerable disturbance in the last 24 hours.
TUC - Tucson
Sun, 15 Mar 2015 14:10:00 GMT
Current F47509 nT
Nominal F47993 nT
Change in F-484 nT
U.S. Total Electron Content. I found this page useful to observe during a Solar Geomagnetic Storm.
Space weather data provided by the
NOAA Space Weather Prediction Center Space Weather There were 3 new reported solar weather events/predictions in the past 24 hours.
Space Weather Message Code: WATA20
Serial Number: 609
Issue Time: 2015 Mar 15 1329 UTC
WATCH: Geomagnetic Storm Category G1 Predicted
Highest Storm Level Predicted by Day:
Mar 16: None (Below G1) Mar 17: None (Below G1) Mar 18: G1 (Minor)
THIS SUPERSEDES ANY/ALL PRIOR WATCHES IN EFFECT
NOAA Space Weather Scale descriptions can be found at
www.swpc.noaa.gov/noaa-scales-explanation
Potential Impacts: Area of impact primarily poleward of 60 degrees Geomagnetic Latitude.
Induced Currents - Weak power grid fluctuations can occur.
Spacecraft - Minor impact on satellite operations possible.
Aurora - Aurora may be visible at high latitudes, i.e., northern tier of the U.S. such as northern Michigan and Maine.
--------------------------------------------------------------------------------
Space Weather Message Code: ALTTP4
Serial Number: 500
Issue Time: 2015 Mar 15 0207 UTC
ALERT: Type IV Radio Emission
Begin Time: 2015 Mar 15 0127 UTC
NOAA Space Weather Scale descriptions can be found at
www.swpc.noaa.gov/noaa-scales-explanation
Description: Type IV emissions occur in association with major eruptions on the sun and are typically associated with strong coronal mass ejections and solar radiation storms.
--------------------------------------------------------------------------------
Space Weather Message Code: ALTTP2
Serial Number: 1001
Issue Time: 2015 Mar 15 0206 UTC
ALERT: Type II Radio Emission
Begin Time: 2015 Mar 15 0127 UTC
Estimated Velocity: 745 km/s
NOAA Space Weather Scale descriptions can be found at
www.swpc.noaa.gov/noaa-scales-explanation
Description: Type II emissions occur in association with eruptions on the sun and typically indicate a coronal mass ejection is associated with a flare event.
--------------------------------------------------------------------------------


