Feb 10, my morning blood sugar reading was 98, which was 35 points lower than yesterday, which is good, but I am not sure if all of these symptoms are related; because, while my allergies continue to worsen, my blood sugar has lowered. Joint pain has not increased over yesterday.
My working hypothesis has been that my allergies, rheumatoid arthritis and diabetes are all due to an inflammatory condition, which is due to the rise in solar activity. Arguably we are over the solar max, yet we have recent solar activity. So, now the question that remains is, is it possible that inflammatory conditions are exacerbated by a the rise in solar activity, but different organ systems are targeted at different times, and when an organ systems is targeted, then other organ systems, which were targeted in the past, get a break and experience some recovery? Well, that sounds like a reach to me, but it is worth investigating.
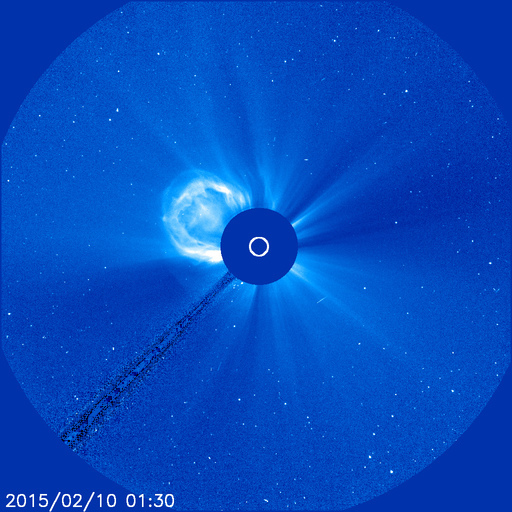
We had another coronal mass ejection yesterday
Real-Time Geomagnetic Conditions total magnetic field (scalar) TUC Tucson Geomagnetic station 47478.3 nT to 47523.2 nT varying 44.9 nT, with a mean of about 47510 nT.
TUC - Tucson
Tue, 10 Feb 2015 15:00:00 GMT
Current F47519 nT
Nominal F47993 nT
Change in F-474 nT
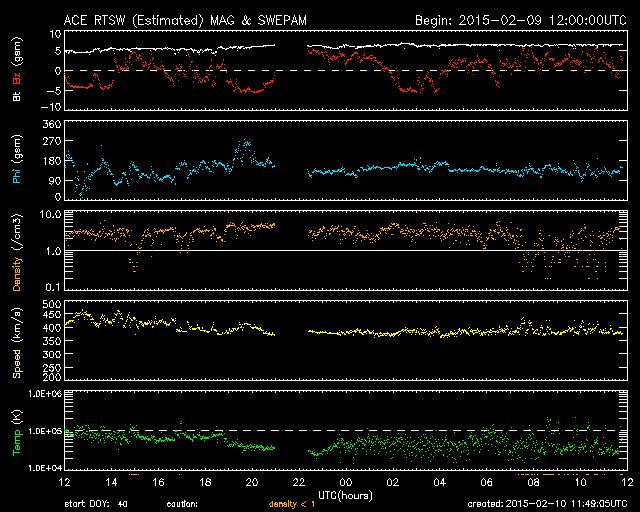 Space Weather Prediction Center ACE Real-Time Solar Wind
 chart 02-09 to 10-2015.
U.S. Total Electron Content. Perhaps I will see a clear relationship in this data set to my health issues.
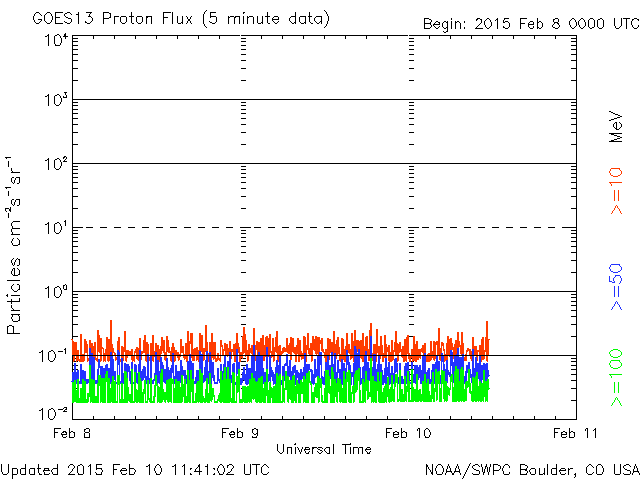
GOES Proton Flux 02-07 to 02-09-2015, shows the solar storm impact to the earth at this wavelength is over, and has been stable for some time.
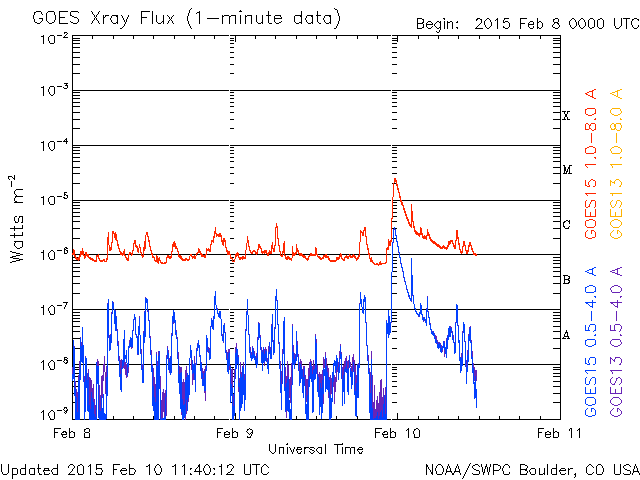
GOES X-Ray Flux chart 02-08 to 10-2015, shows a significant x-ray spike due to the recent CME.
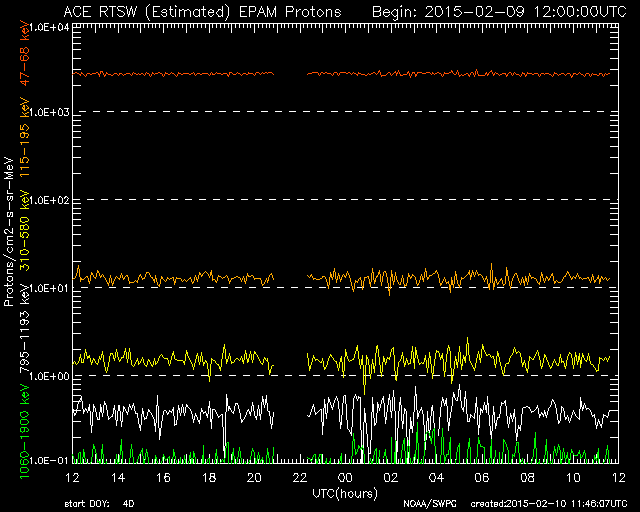
The Electron Proton Alpha Monitor (EPAMp)02-08 to 10-2015 shows the impact to the earth of the recent solar wind storm has stablized.
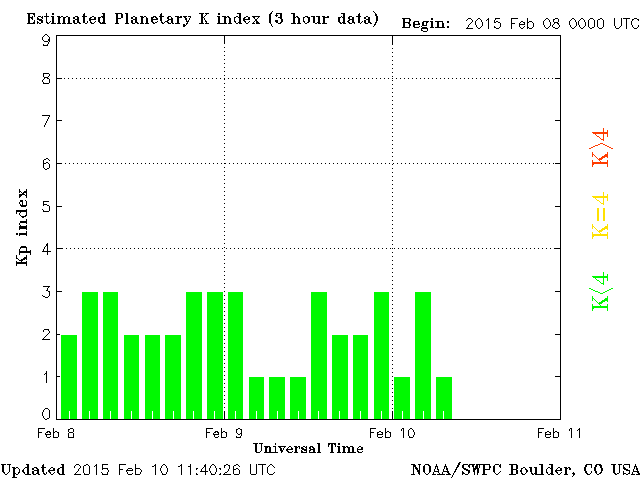
Estimated Planetary K-Index shows the K index is still declining
Space Weather 2 new reported solar events in the past 24 hours, which are possibly related to the recent CME.
Space Weather Message Code: ALTTP4
Serial Number: 491
Issue Time: 2015 Feb 10 0033 UTC
ALERT: Type IV Radio Emission
Begin Time: 2015 Feb 09 2335 UTC
NOAA Space Weather Scale descriptions can be found at
www.swpc.noaa.gov/noaa-scales-explanation
Description: Type IV emissions occur in association with major eruptions on the sun and are typically associated with strong coronal mass ejections and solar radiation storms.
--------------------------------------------------------------------------------
Space Weather Message Code: ALTTP2
Serial Number: 993
Issue Time: 2015 Feb 09 2358 UTC
ALERT: Type II Radio Emission
Begin Time: 2015 Feb 09 2323 UTC
Estimated Velocity: 1190 km/s
NOAA Space Weather Scale descriptions can be found at
www.swpc.noaa.gov/noaa-scales-explanation
Description: Type II emissions occur in association with eruptions on the sun and typically indicate a coronal mass ejection is associated with a flare event.
--------------------------------------------------------------------------------


